


🔴 Here's Why Bitcoin Keeps Coming Back

This report is provided for informational purposes only. I am not a financial advisor, and this report does not constitute investment advice. The information contained within is based on data available at the time of writing and is subject to change without notice.
By reading this report, you acknowledge and agree that any use of the information provided in this report is at your own risk. You shall not initiate litigation against the author or The Bleeding Edge for any decisions, actions, or outcomes resulting from your interpretation or use of the information contained herein. This includes, but is not limited to, any loss of profit, loss of investment, or other financial outcomes.
With the disclaimer out of the way, let’s get into the fun stuff.
Bitcoin’s price has followed a similar pattern roughly every four years. This pattern originates from ‘The Halving’ cutting the quantity of new Bitcoin entering circulation in half.
What We’ll Explore In This Report
Three different types of money
The halving in simple terms
The halving’s effect on Bitcoin’s price
The Shape of Money
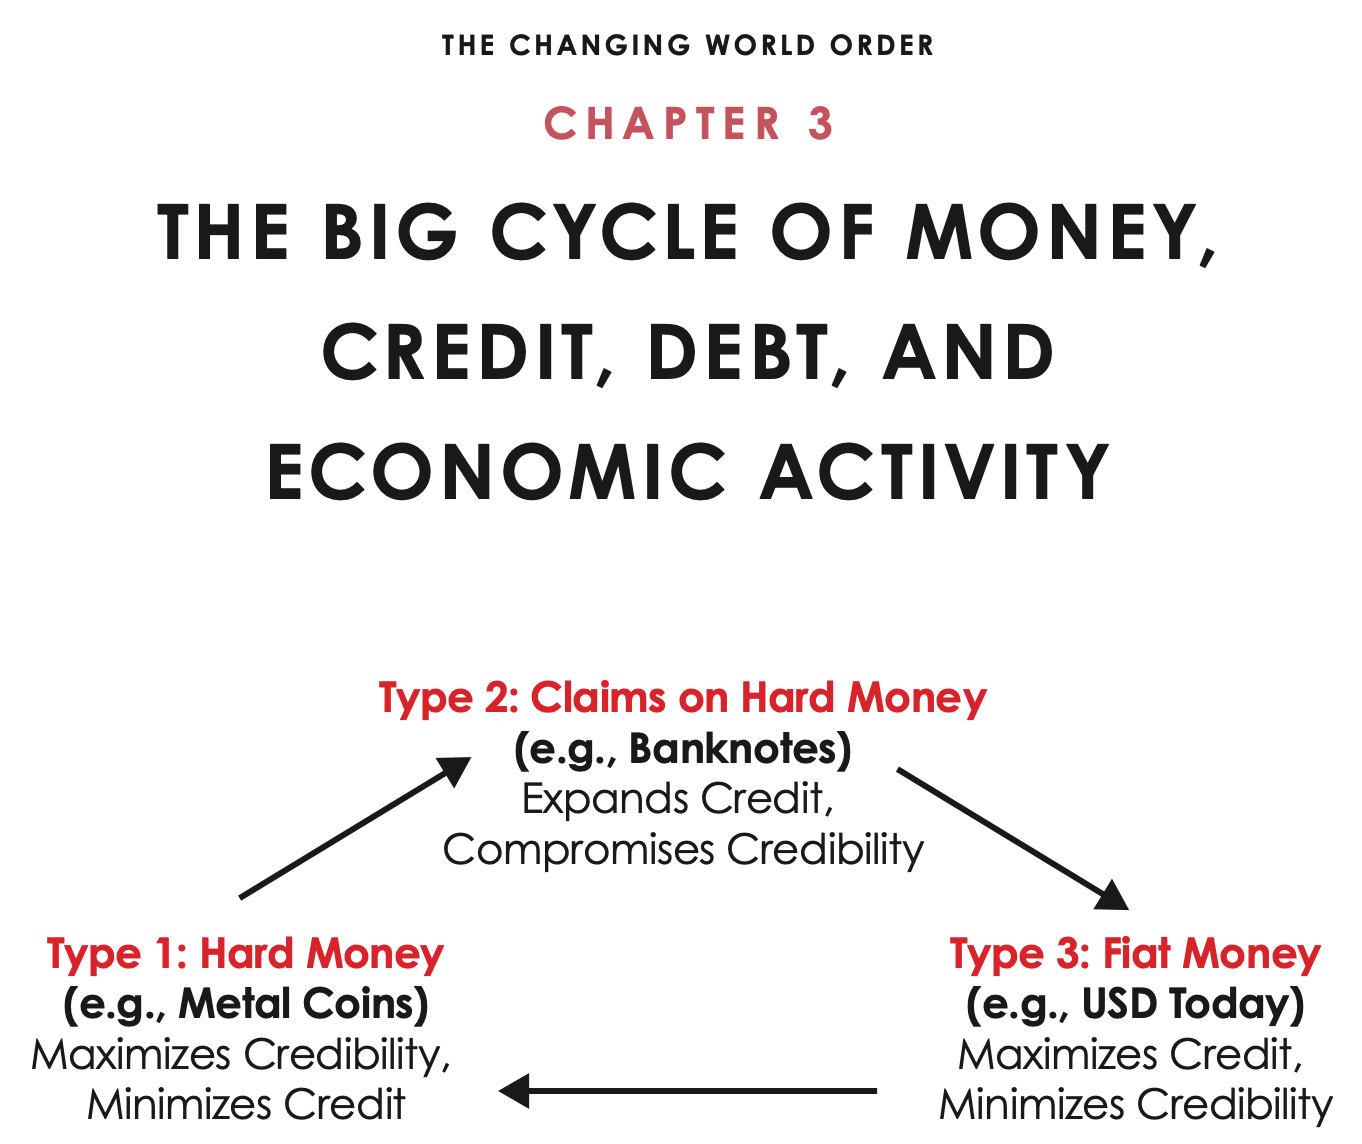
Money goes through a cycle of what it represents.
When a country starts, people need to agree on what money to use. Throughout history, this starts with precious metals like gold, silver, and copper.
Type 1, Hard Money: The money is quite literally a coin made of a hard, precious metal like gold, silver, or copper. The value of the coin is based on the specific amounts of gold, silver, or copper they contain.
The United States used hard money made of copper, silver, and gold in 1792, starting with the Coinage Act of 1792.
Type 2, Claims on Hard Money: The precious metal coins are great for a store of value, but don’t necessarily facilitate economic growth as fast as society would like. To facilitate economic growth, banks will give out notes that represent claims on hard money. That is, you can turn your note in for an equivalent amount of hard money like gold.
The United States had a series of state-charters banks from 1791-1862 that issued many different types of banknotes, with many (but not all) of them representing claims on hard money. It wasn’t until the National Banking Acts of 1863 and 1864 that the United States Federal government agreed on a unified banknote currency system.
Inevitably, the banks end up issuing more notes than what they have in the vault, resulting in a run on the bank when many people want to claim.
Type 3, Fiat Money: As time goes on, using banknotes becomes the norm and society enjoys the growth that the extra money in circulation provides so much that when the bank runs happen, the most agreeable course of action is to default on the ability to claim hard money. The banknotes then represent debt, allowing the central banks to print more or less at will based on the needs of the economy.
The United States moved to this system in 1971, when President Nixon announced you would no longer be able to exchange your notes for gold.
This is the system the United States currently has.
As you can see, the amount of currency in circulation has been increasing exponentially since the Federal Reserve was established in 1913.
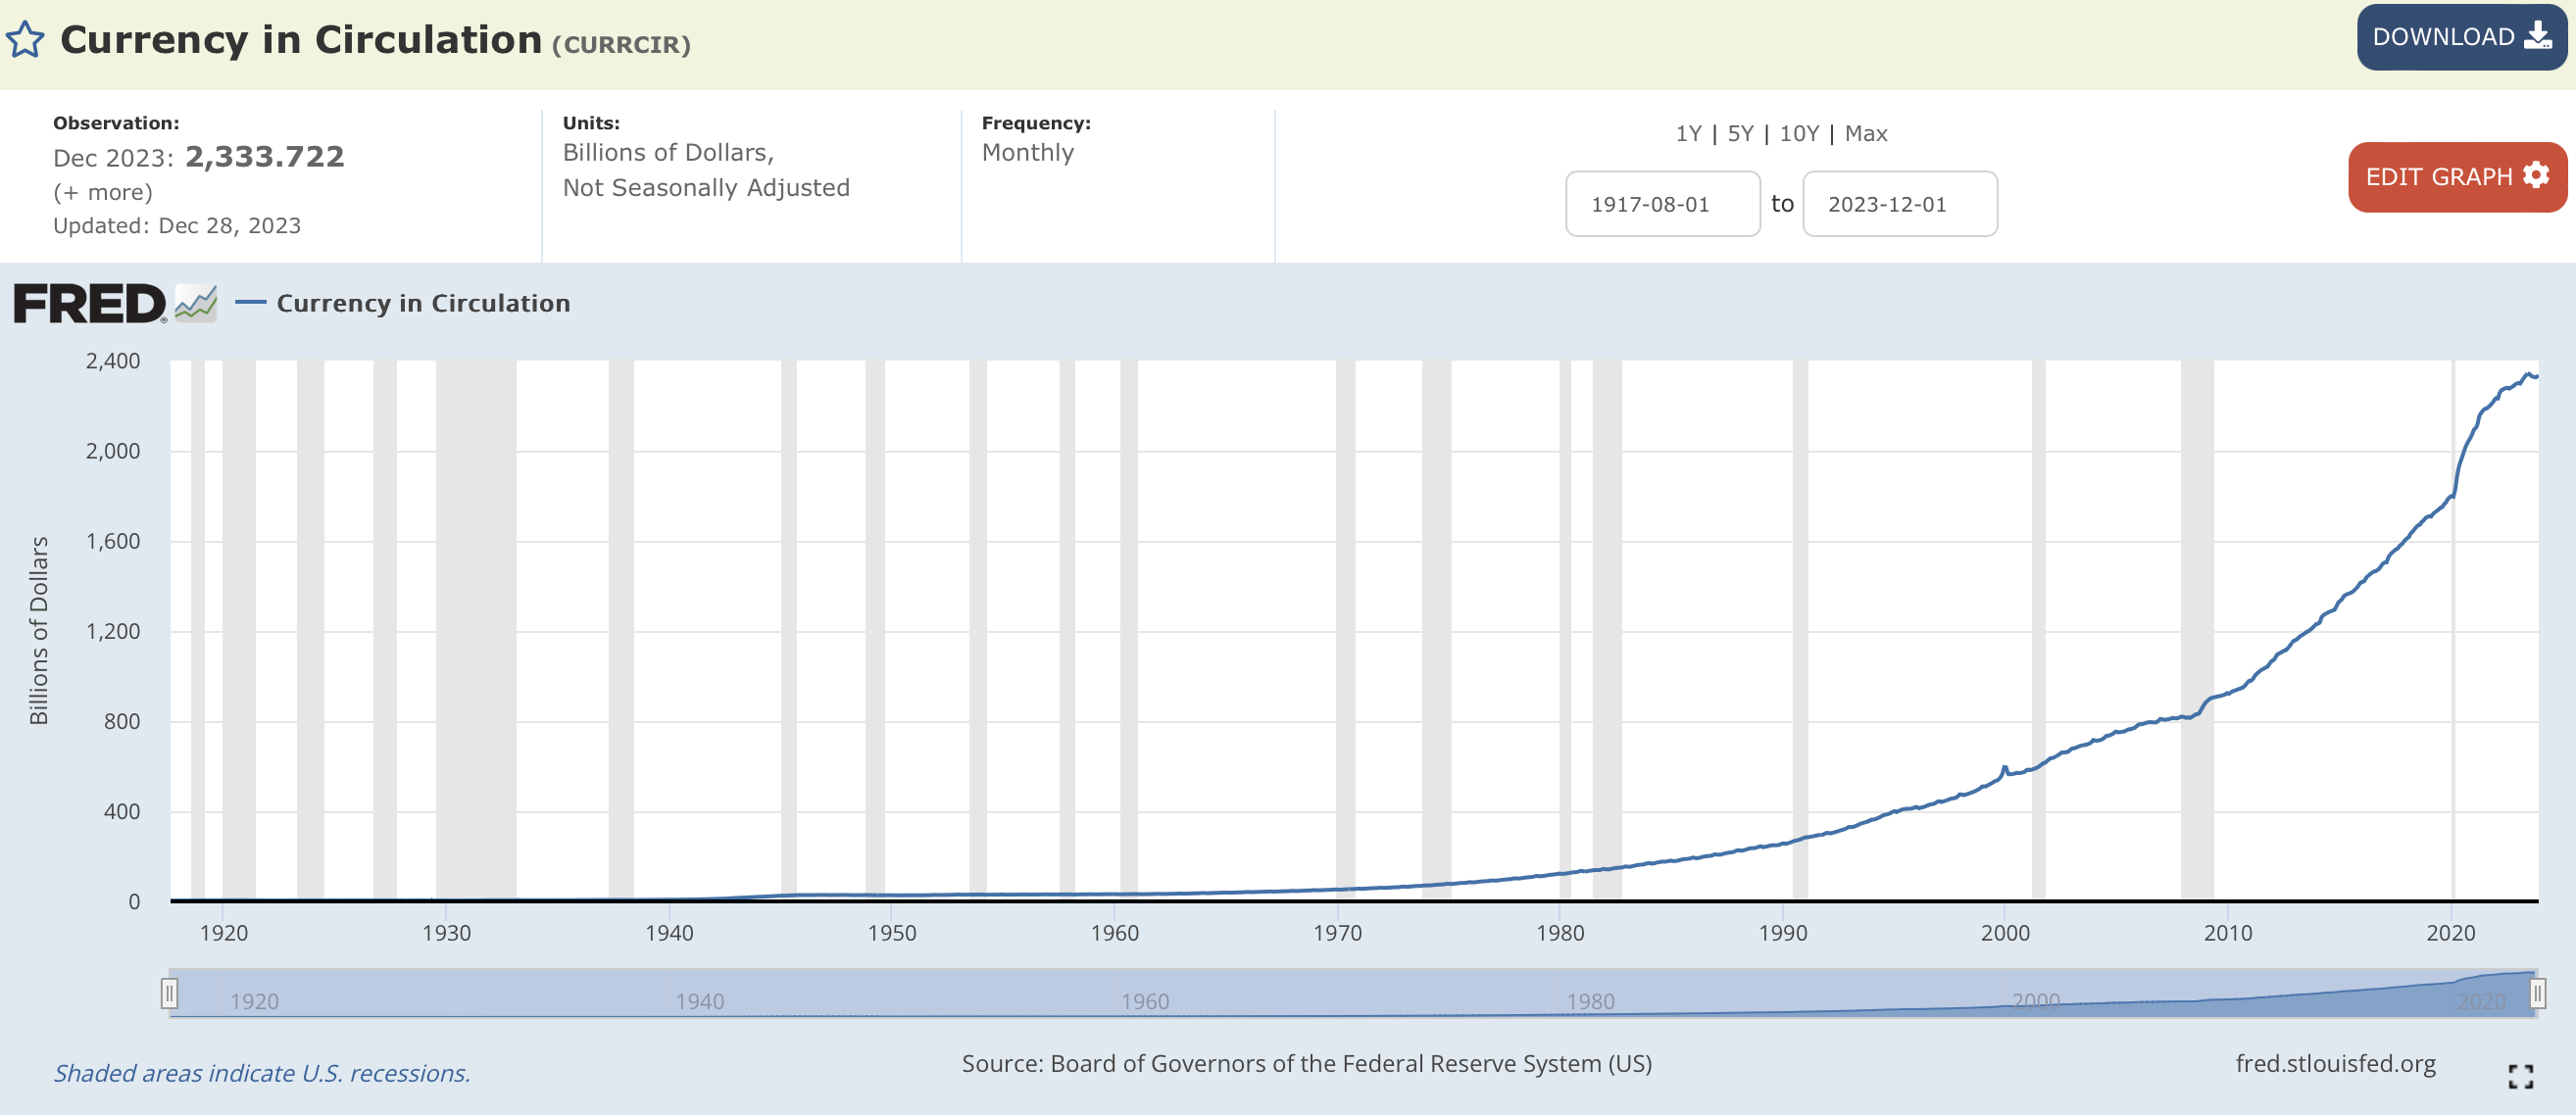
To be fair, if you zoom into any 10-year period, the chart looks essentially the same as the one above. In the fiat system, money is constantly being printed. As the supply of currency increases, the value of each dollar goes down.
The Halving In Simple Terms
Let’s get into how Bitcoin’s supply works, and why it falls under Type 1, Hard Money.
There will only ever be a limited amount of Bitcoin, capped at 21,000,000 total.
Bitcoin was created on January 3rd, 2009. On that day, the first 50 Bitcoin entered circulation. From then on, 50 new Bitcoins entered circulation approximately every 10 minutes. That would continue until about 4 years later when the number of new Bitcoins created was cut in half to 25 Bitcoins every 10 minutes.
This halving of new Bitcoin entering circulation was pre-programmed from the very beginning and is meant to replicate a gold mine finding most of the supply of gold during the first few years of operation and tapering off as time goes on.

So far, Bitcoin has undergone three “halving events”
Nov 28, 2012: New Bitcoin reduced from 50 BTC to 25 BTC every 10 minutes
Jul 9, 2016: New Bitcoin reduced from 25 BTC to 12.5 BTC every 10 minutes
May 11, 2020: New Bitcoin reduced from 12.5 BTC to 6.25 BTC every 10 minutes
At the time of writing, there are 19,599,081 Bitcoin in circulation. Per the supply schedule, there will only ever be 21,000,000 Bitcoins in existence, with the last one entering circulation around the year 2140.
Bitcoin is the most valuable cryptocurrency by market cap because it’s the first system in the world to be a fully permissionless, decentralized payment network. If you’re interested in understanding the mechanics behind the curtain, you can read about how new bitcoins are created, and why it’s set up that way. The checks and balances Bitcoin’s system employs to keep the Bitcoin payment network operational worldwide is a beautifully complex system.
Bitcoin’s limited supply has the limited supply characteristics of precious metals and the transportability of a banknote. Importantly, unlike a bank note, having Bitcoin is not a claim on Bitcoin. You either hold the Bitcoin in your possession or you don’t.
It’s important to note that part of how Bitcoin gets its value is society’s belief that it has value (just like a fiat system). The question is, do people value owning Bitcoin? Everything you’ve read above is a contributing factor to why people believe Bitcoin is worth something.
A governing body’s stamp of approval helps to build the legitimacy of Bitcoin’s value.
On January 11th, 2024, the United States Securities and Exchange Commission approved the very first round of Bitcoin ETFs (Exchange Traded Fund). The ETF allows established financial institutions like Fidelity, Schwab, and Invesco to invest in Bitcoin for their customers. Simply put, traditional financial institutions, and the U.S. government, agree that there are enough people that believe in Bitcoin to categorize it as a legal, regulated asset class.
The Halving’s Effect On Bitcoin’s Price
Bitcoin’s price has acted eerily similar every four years and it’s all got to do with the halving.

The chart above depicts the full trading history of Bitcoin, with the halvings represented by vertical black lines.
Here’s a breakdown of the human psychology that drives this price action cycle after cycle. Use the chart above as a visual reference.
Year 1 after halving: The halving happens and let’s assume demand for Bitcoin stays consistent with the previous year. The supply is growing at only 50% the rate it used to. The laws of supply and demand say that price goes up. That’s historically been the case the year after the halving.
Year 2: With the price having gone up over the past year, word of mouth begins. Whispers of an investment going up ~3x in a year spreads through group chats and conversations with friends. New folks want to make money too, so they buy, driving demand up. Year 1 & 2 are where most of the price increase happens.
Year 3: What goes up, must come down. Folks who bought two years ago could be up 5,10x, 20x on their initial investment. They begin cashing in, and demand starts to slow down. People begin to lose money and decide to sell, causing many others to do the same. Demand is way down, and so is price.
Year 4: With price having gone down 50-70% the year before, long-term investors are scooping up crypto at a great price if they plan to hold until the next cycle. With those investors bringing demand back to life, price begins to go up. WIth the halving coming soon, the cycle starts over again.Now, let’s take a look at the same chart, this time zoomed in to see more detail.

Do you notice the repeating patterns in this chart?
Every cycle there’s a new high, a drastic low, and a slow movement back up, leading into the next cycle’s high.
Now let’s zoom into the 2016 - 2020 cycle and add some labels for notable dates happening in the cycle.
Bitcoin, 2016 - 2020

Green: Halving to All-Time High (518 days)
Orange: Halving to Bear Market Breakout (994 days)
Red: Halving to Cycle Low (882 days)
Purple: Lowest Time During Cycle (112 days)
Blue Arrow: Cycle High to Next All-Time High (1,085)
Teal: Cycle Low To Next Cycle High (1,064 days)
I then took those indicators, and pasted them onto the halving we’re experiencing now.
Bitcoin, 2020 - 2024

The lengths of all the indicators are exactly the same as 2016 - 2020. Look at how closely these dates align with this cycle.
You’ll notice they’re not lined up exactly, but every single indicator shown in this cycle is accurate within 30 days or less.
If the cycle plays out again, what would the next cycle look like?
Bitcoin, 2024 - 2028

If the timing of the 2016 - 2020 cycle were to repeat at the next halving event, the next All-Time High would happen the week of September 15th, 2025.
In this case, the Cycle Low would happen the week of September 14th, 2026.
There are purposely no price targets in this chart, only date targets.
Keep it simple. It's all just supply and demand.
New All-Time High Update, November 2024:
The price was predicted to be about $70,000 on the week of October 24th, 2024, and that’s exactly where the price reached that week.
As of November 2024, the pattern has played out exactly the same as before.
If you’re reading this in late 2024 or 2025, click here to see the interactive chart with today’s price to see how the trend has played out.

Closing Thoughts
Some of the smartest people in the world devote their lives to perfecting their investment strategy, and they still don’t get it perfect. You are not going to buy the exact bottom or sell the exact top. You should not look at this analysis and plan to go all in by buying on the lowest day and selling it all on the highest day because that’s not realistic.
Time in the market is better than timing the market.
If you have conviction in the multi-year cycles, don’t mess it up by trying to squeeze every last penny out of it. Play the cycles and be happy with what you’re able to get.
The Bleeding Edge is a free weekly newsletter by @ezrawithacamera covering whatever I’m currently interested in. Topics include books, AI, tech, creator tips, inventions, energy, optimism, career growth, history, and just about anything else I find interesting.
I grew up in a tiny farm town mid-Michigan called Webberville and recently moved to New York City to live out my dream of working for @garyvee at @veefriends.
I’ve been working at a GaryVee company for nearly 2 years and love it. This weekly newsletter is my version of building something for myself.
If you’d like to support the cause financially, there is a paid version of the newsletter called The Bleeding Edge Buffet where I compile a list of all the cool things I find each month. The Buffet releases the first weekday of the month for $6 each month. For the price of a coffee, you’re getting a great list of information while supporting me in learning about cool things.
The most recent buffet can be previewed for free here 👇
The Bleeding Edge Buffet #2: Nuclear fusion, life in outer space, a total eclipse, the world economy, AI appetizers, and a whole lot more

At this buffet, you get a long list of things from the past month that I think you’d like. Topics include books, AI, tech, creator tips, inventions, energy, optimism, career growth, history, and just about anything else I find interesting At this buffet, there’s
Hit me up on social media, @ezrawithacamera, if you have any questions or just want to say hi!
Other than that, I hope you have a great day and I’ll see you next Monday at 7 am ET!