🔴 Bitcoin Reaches All-Time Highs. Now What?
In early 2024, I wrote about why Bitcoin’s price keeps coming back.
In the report, I explained
Three different types of money
The halving in simple terms
The halving’s effect on Bitcoin’s price
Key
Green: Halving to All-Time High (518 days)
Orange: Halving to Bear Market Breakout (994 days)
Red: Halving to Cycle Low (882 days)
Purple: Lowest Time During Cycle (112 days)
Blue Arrow: Cycle High to Next All-Time High (1,085)
Teal: Cycle Low To Next Cycle High (1,064 days)
Since posting, Bitcoin just hit a new all-time high seven months ahead of schedule.
The sudden demand for Bitcoin came from the January Bitcoin ETFs. The ETF lowers the barrier of entry for investors because institutions can invest in Bitcoin on behalf of their clients. This legitimized Bitcoin as an asset class while offering an easy path for traditional investors to invest in Bitcoin.
These ETFs now hold almost 800,000 Bitcoin ($55.5 Billion USD), or 4.06% of Bitcoin’s total supply.
Not to mention, the speculation and hype from retail investors that are tied to an ETF launch.
Given this new all-time high, there are two scenarios.
The all-time high will happen faster than predicted
The all-time high is a fakeout and Bitcoin’s price will drop before or after the halving.
It’s hard to tell, and frankly, I’m not interested in searching for a definitive answer. My strategy remains the same. I will buy what I can afford to buy every week. I’ve set it up to happen automatically on Coinbase. When I do that, my money grows no matter what, as long as I hold it for more than four years.
The strategy is simple, but most people don’t have the patience to execute a 4+ year investment plan, as I’ve written about here.
To properly play the four-year cycle, we’ll need more data than what the original report included.
Here are two more indicators to help you understand the Bitcoin cycle.
Top Indicator
Long story short, when the yellow line crosses the green line, it’s a good time to sell some Bitcoin.
Quick description of moving averages
A moving average is a charting tool that shows the average price within a specific time period. Comparing time periods is a good way to see how much momentum is behind an asset.
Full description of the yellow and green lines, from lookintobitcoin.com
The Pi Cycle Top Indicator has been effective in timing the market cycle highs within 3 days.
It uses the 111-day moving average (111DMA) and a newly created multiple of the 350-day moving average, the 350DMA x 2.
Note: The multiple is of the price values of the 350DMA not the number of days.
For the past three market cycles, when the 111DMA moves up and crosses the 350DMA x 2 we see that it coincides with the price of Bitcoin peaking.
Bitcoin’s price broke through the green line for the first time since late 2020 (At the time of writing, March 2024)
We’re trending toward the next cycle’s all-time high. It could take a year or two, but the process is happening.
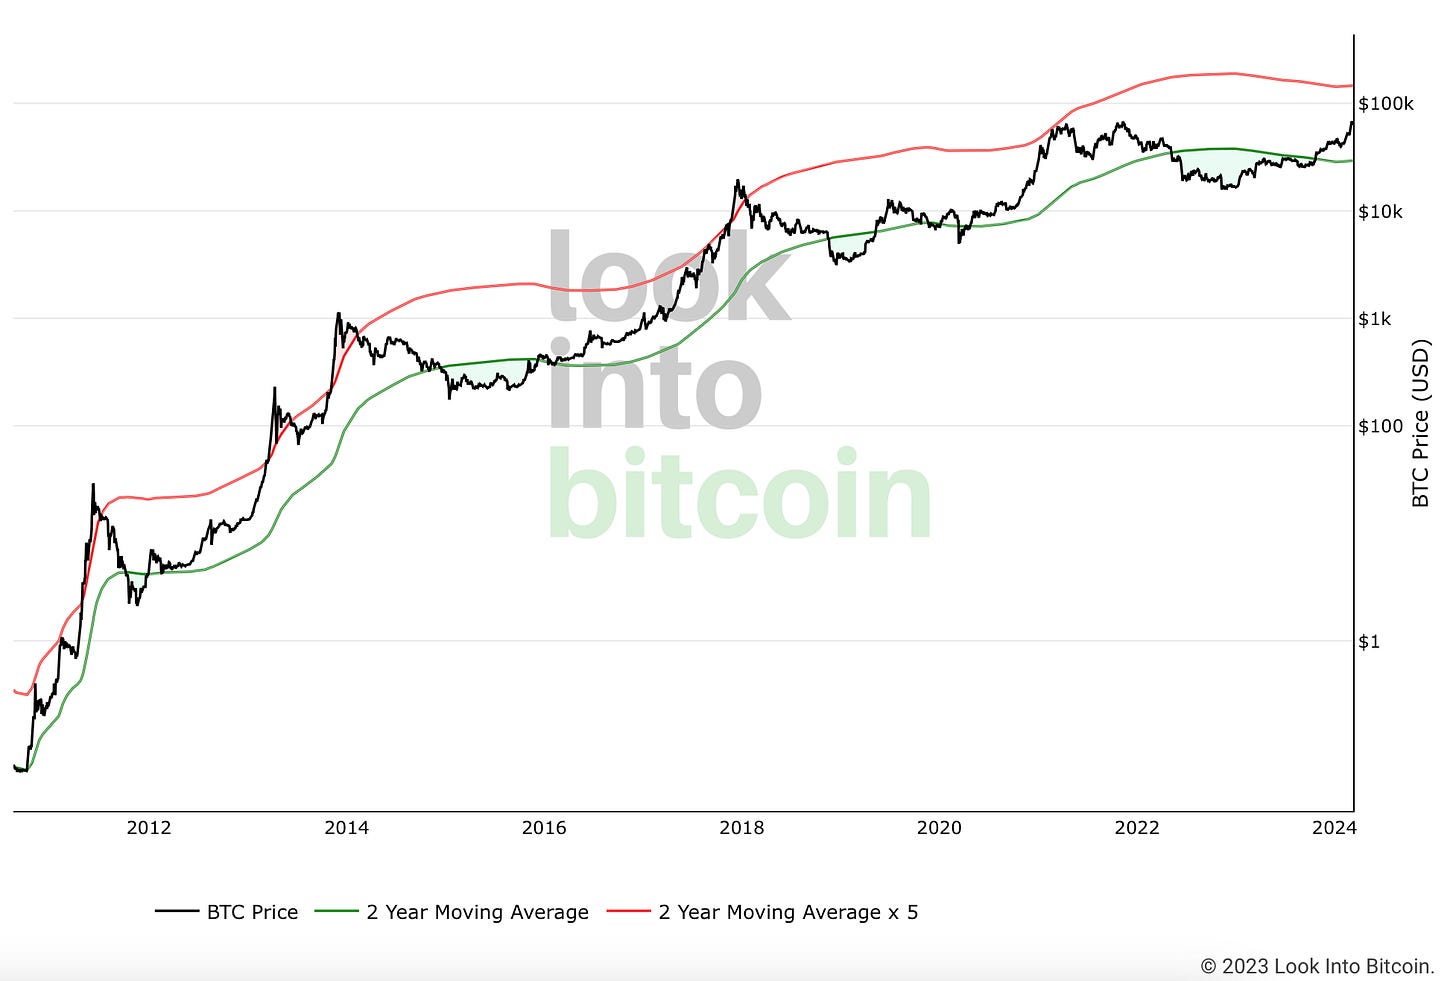
Bitcoin 2-Year Moving Average Multiplier
The 2-Year Moving Average Multiplier is intended to be used as a long-term investment tool.
The chart above uses moving averages to show where Bitcoin is over or undervalued compared to previous cycles.
To do this, it uses moving averages. A moving average is an indicator based on past prices within a specific time period. In this case, it’s the average price over the previous two years.
The chart above uses a 2-year Moving Average (MA), and also a 5x multiplication of that moving average line. This means the red line is the same as the green line, but multiplied by x5.
This tool can be used to indicate whether the price of Bitcoin today is at…
Historically low levels (under green line)
Historically high levels (over red line)
Neutral level (between green and red lined)
It’s a useful tool for investors to understand if Bitcoin is currently over or undervalued.
Remember. A four-year cycle is a long time. Try not to get caught up in the week-to-week price action. Don’t overwork for the money, let the money do the work. Keep a long-term mindset and don’t let your emotions make your decision.
Between this four-year cycle chart and the two charts above, you have all the data you need to play the cycle correctly.
The Bleeding Edge Plus is 61% Off (Limited Time)
I’ve created and curated content that has reached 15,000,000+ people. I share exclusive information on how to build your brand by talking about the things you love.
In The Bleeding Edge Plus, you get exclusive information on how to grow brands like
VeeFriends on Instagram (Business brand)
My personal brand (Personality brand)
The Bleeding Edge newsletter (Informational newsletter)
My art project (Using AI In Art)
My online mug store (Dropshipping)
Then, you get actionable steps on how to apply it to your brand and business.
Paying for your monthly subscription up front means you get 12 in-depth newsletters on how to grow your brand for $5.83 per newsletter.
This is a limited offer. The yearly subscription will never be cheaper than this.


Not my favorite post but very informative. I wouldn’t mind seeing more crypto/investment posts though, just on a broader spectrum while still providing important bits of information.